C FFT Visualizer
Real-time audio spectrum visualizer using C, FFTW3, Raylib, and PortAudio.
Highlights
- Log-frequency bars with fractional-octave smoothing (1/1…1/48)
- dB-domain time averaging (EMA) + per-band peak-hold/max-hold
- Mic or WAV input via PortAudio; weighting modes (Z/A/C) + pink compensation
Overview #
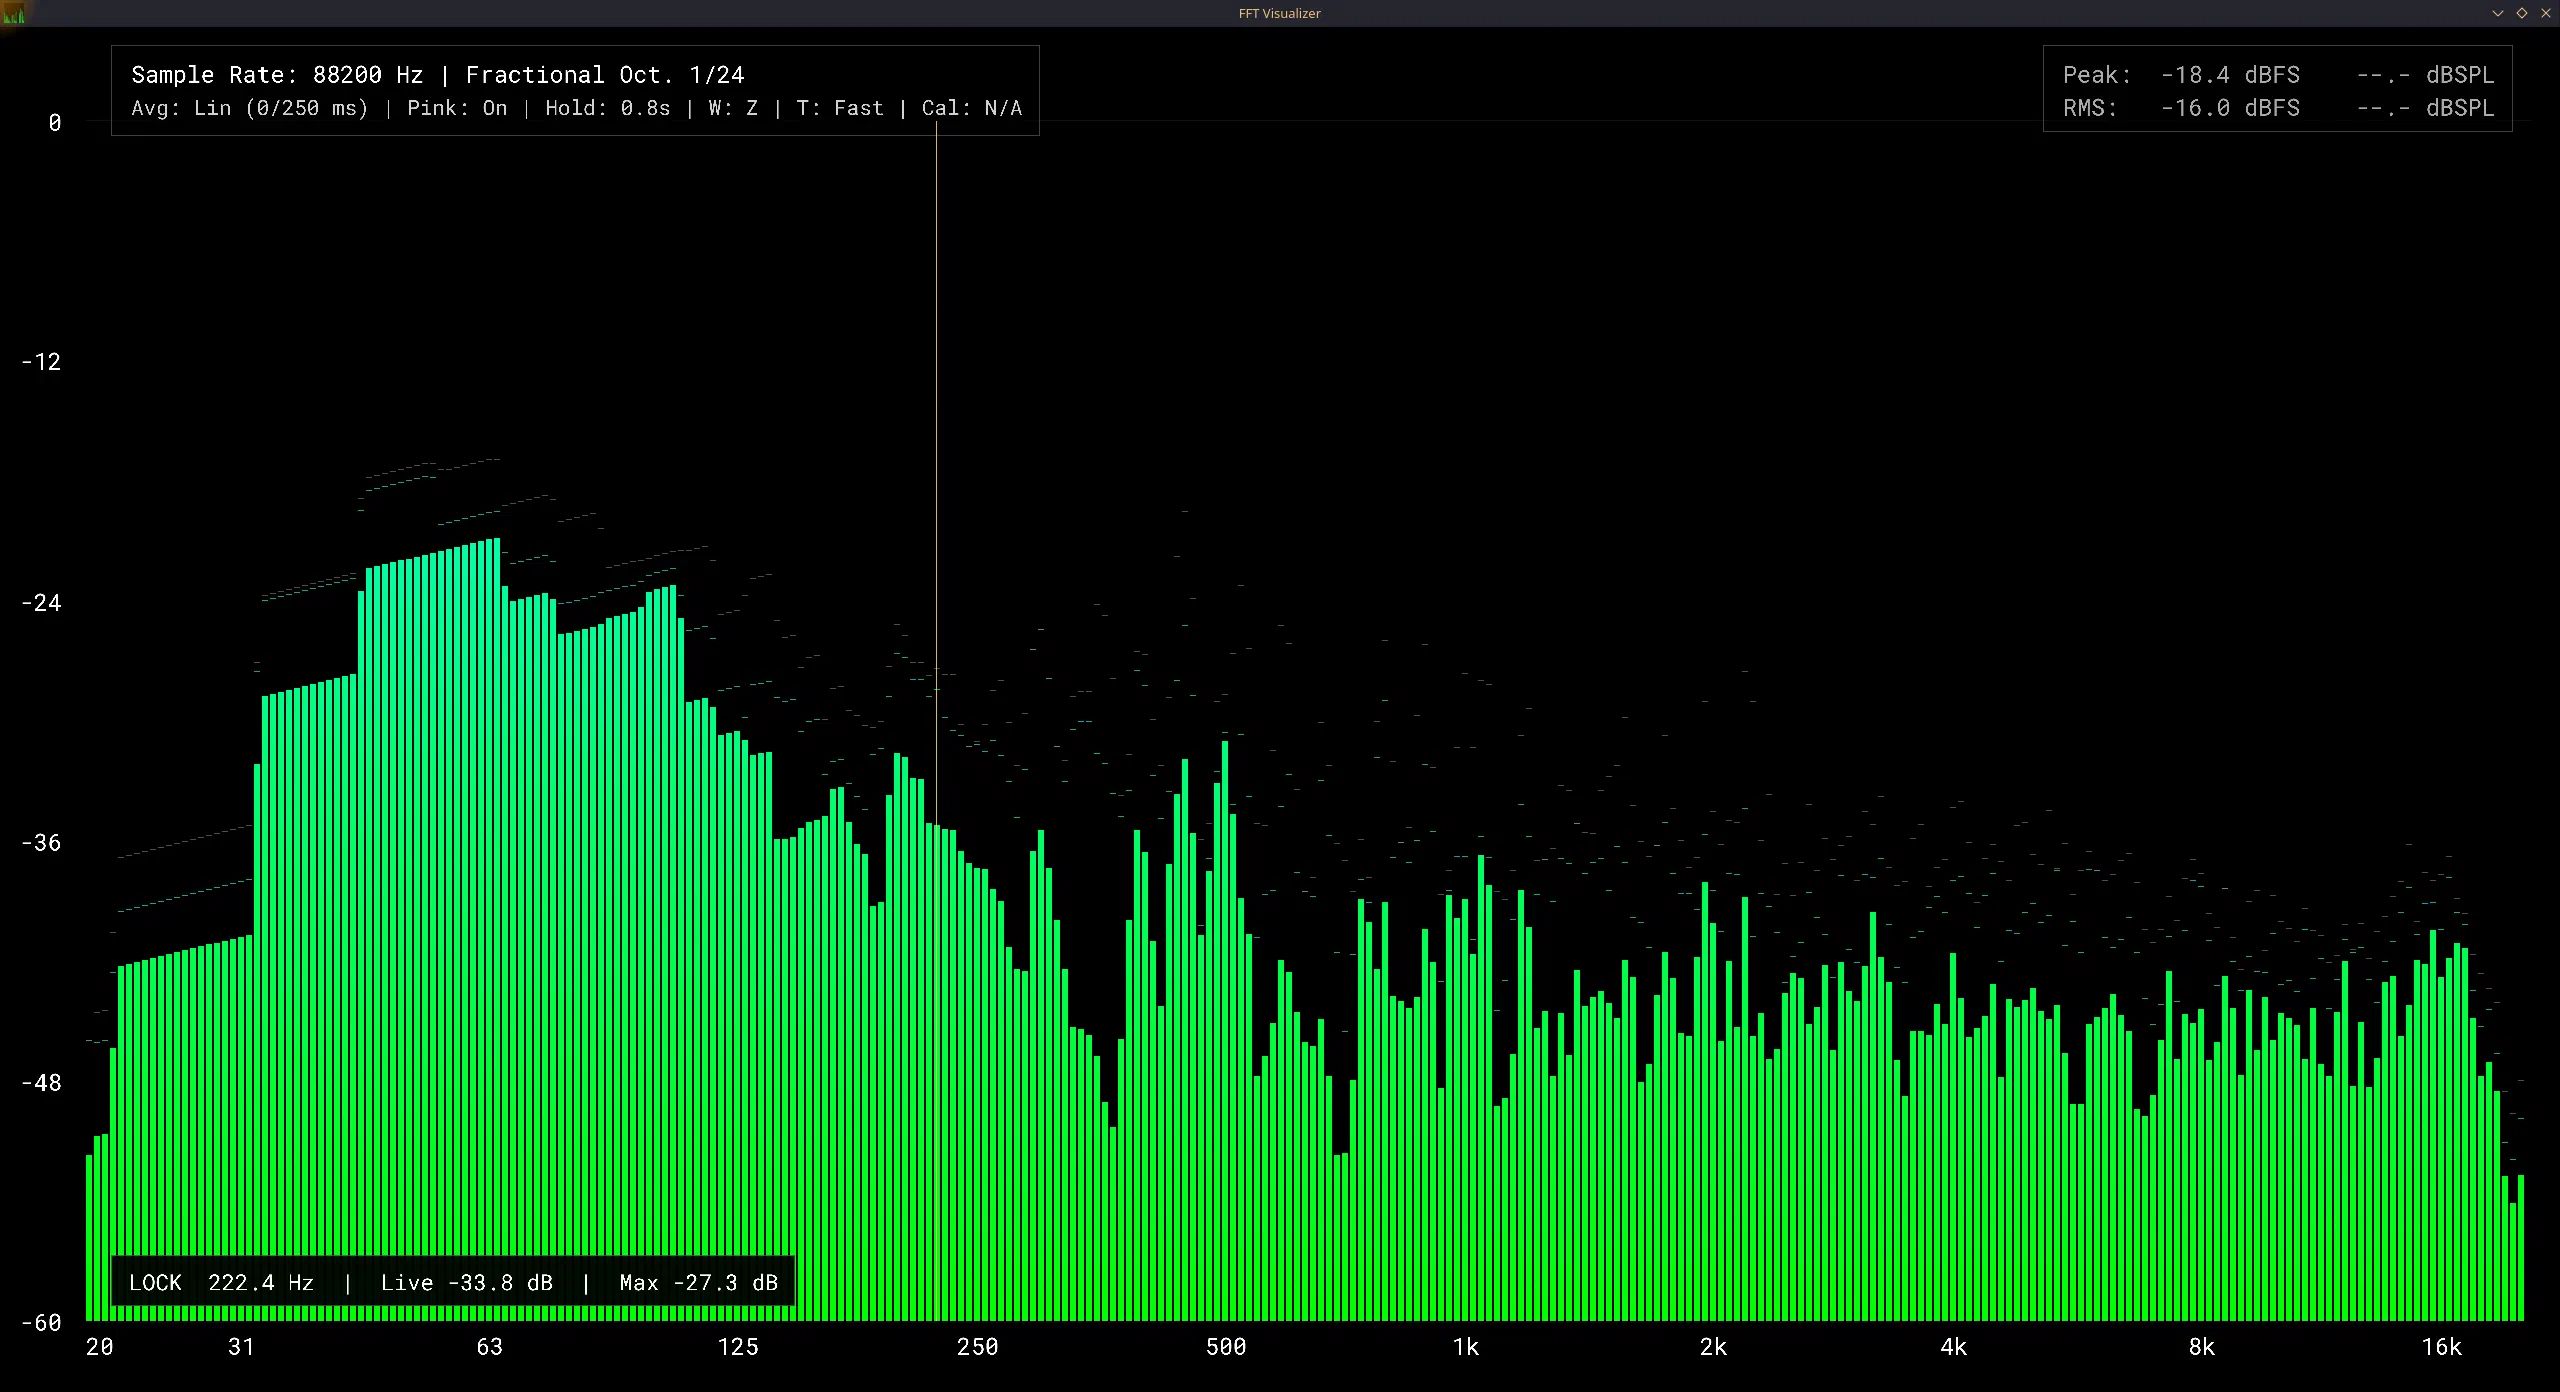
A real-time FFT visualizer that renders log-frequency bars with fractional-octave smoothing, per-band peak-hold, and pink-noise compensation. Works with .wav files or a live microphone input.
Warning: Early prototype. Sample rates of 48kHz and higher may make the visualization lag relative to the audio.
Problem / approach #
- Visualize audio spectra smoothly with configurable averaging and scaling.
- Keep latency low while supporting multiple smoothing/averaging modes.
- Provide flexible input: file playback or live mic.
Solution #
- C + FFTW3 for frequency analysis, Raylib for rendering, PortAudio for audio I/O.
- RTA-style analysis controls: fractional-octave smoothing, dB-domain averaging (EMA), peak-hold + max-hold trace, and cursor readouts.
- Display/analysis modes: pink compensation (pink-flat display) and frequency weighting (Z/A/C) with meter time-weighting.
- Mic-mode SPL calibration workflow (94 dB calibrator via key command).
Features #
- Log-frequency bars with fractional-octave smoothing (1/1…1/48)
- dB-domain time averaging (EMA) with Fast/Slow presets
- Per-band peak-hold with timed decay + persistent max-hold trace
- Peak-find + nearest-band lock navigation
- Cursor readout (hover for exact Hz and level)
- Pink compensation + frequency weighting modes (Z/A/C)
- dB grid overlay and peak/RMS meters
Controls (high level) #
Ooctave scaling,Ccolor gradients,Ppink compensationAdB-domain averaging,Ffast/slow preset,Hpeak-hold modesWZ/A/C weighting,Tmeter time-weightingKcalibrate SPL to 94 dB (mic mode),Gpeak-find + cursor lockF11fullscreen,Spacefreeze,Rreset traces
Outcome #
- Responsive RTA-style display with dB-domain averaging and peak tracking.
- Works on typical Linux setups (e.g.,
sudo pacman -S clang raylib fftw portaudio). - GPL-3.0 licensed, ready for tweaking visuals or analysis settings.