Projects
Galaxy visualization
Visualizing 100k real, 100k randomly distributed galaxies and redshift data with Raylib OpenGL frontend.
Highlights
- Visualizes 100,000 real galaxies, 100,000 random points and redshift data
- GPU-parallel assignment context: compute 10B pair angles on a GPU
- Embedded assets build: single portable ~6 MB binary with all data compressed
- Cross-compilation for Windows via mingw64
- Performance notes documented in the repo (expected ~3s; optimized to ~0.26s on RX 6900 XT)
Overview #
This project visualizes 100,000 real galaxies (blue) and 100,000 randomly distributed points (red) + redshift galaxy data. The data and assignment come from the GPU programming course at Åbo Akademi University.
Pre-built binaries for Linux and Windows are available from the: v0.5.1 release
Problem / assignment #
The student assignment is to use parallel GPU programming (CUDA or HIP) to compute 10 billion angles between galaxy pairs and demonstrate whether the galaxy distribution is random. Students are expected to run the computation on a small cluster or a single GPU. A short post about the problem and my solution approach is available on my blog: HIP Deep Dive: 10B Galaxy-Pair Angles on AMD (~0.15s)
Build & prerequisites #
The repository provides two build options: a build.sh wrapper (uses clang) or Meson (recommended for IDE integration). The visualization depends on Raylib (tested with v5.5-1). Other prerequisites listed in the repo include Git, base development tools (e.g. build-essential), Clang (or GCC), and optionally Meson, Python3 (for embedded build compression), and gdb.
Build options #
| Option | Description | Binary Size |
|---|---|---|
| Normal | External assets required | ~45 KB |
| Embedded | All assets compressed into binary | ~6 MB |
| Static Raylib | Raylib linked statically, system libs dynamic | Varies |
Build options for the galaxy visualization project.
The embedded binary includes fonts, shaders, 3D models, all galaxy data (100k points × 2 datasets), and redshift survey data - compressed with zlib.
Using build.sh #
chmod +x ./build.sh

# Normal build (with external assets)
./build.sh

# Embedded build (single portable binary)
./build.sh --embed

# Embedded + static raylib
./build.sh --embed --static

# Build and run
./build.sh --embed --run
Using Meson #
# Normal build
meson setup build
meson compile -C build
./build/galaxy_visualization_raylib

# Embedded build (single portable binary)
meson setup build_embedded -Dembed_assets=true
meson compile -C build_embedded
./build_embedded/galaxy_visualization_raylib
Cross-compiling for Windows (mingw64) #
Install a mingw64 toolchain, then:
# Download raylib subproject (required for static linking)
meson subprojects download raylib

# Configure and build Windows .exe (embedded + static raylib)
meson setup build_mingw --cross-file ./cross/mingw64.ini -Dembed_assets=true -Draylib_static=true
meson compile -C build_mingw
Or using build.sh --mingw.
Notes on performance #
The expected runtime for the full calculation is roughly 3 seconds, and it is possible to optimize a solution to about 0.26 seconds on a single AMD RX 6900 XT (my test). The repository emphasizes that the program here is the visualization of the data and not the solution to the course assignment.
Data sources #
Earth model: NASA VTAD earth 3D model (credit in repo).
CfA Redshift Survey: Huchra redshift catalog from the Harvard-Smithsonian Center for Astrophysics.
SAGA Survey: Satellite Systems around Milky Way-mass Galaxies (DOI: 10.3847/1538-4357/ad64c4).
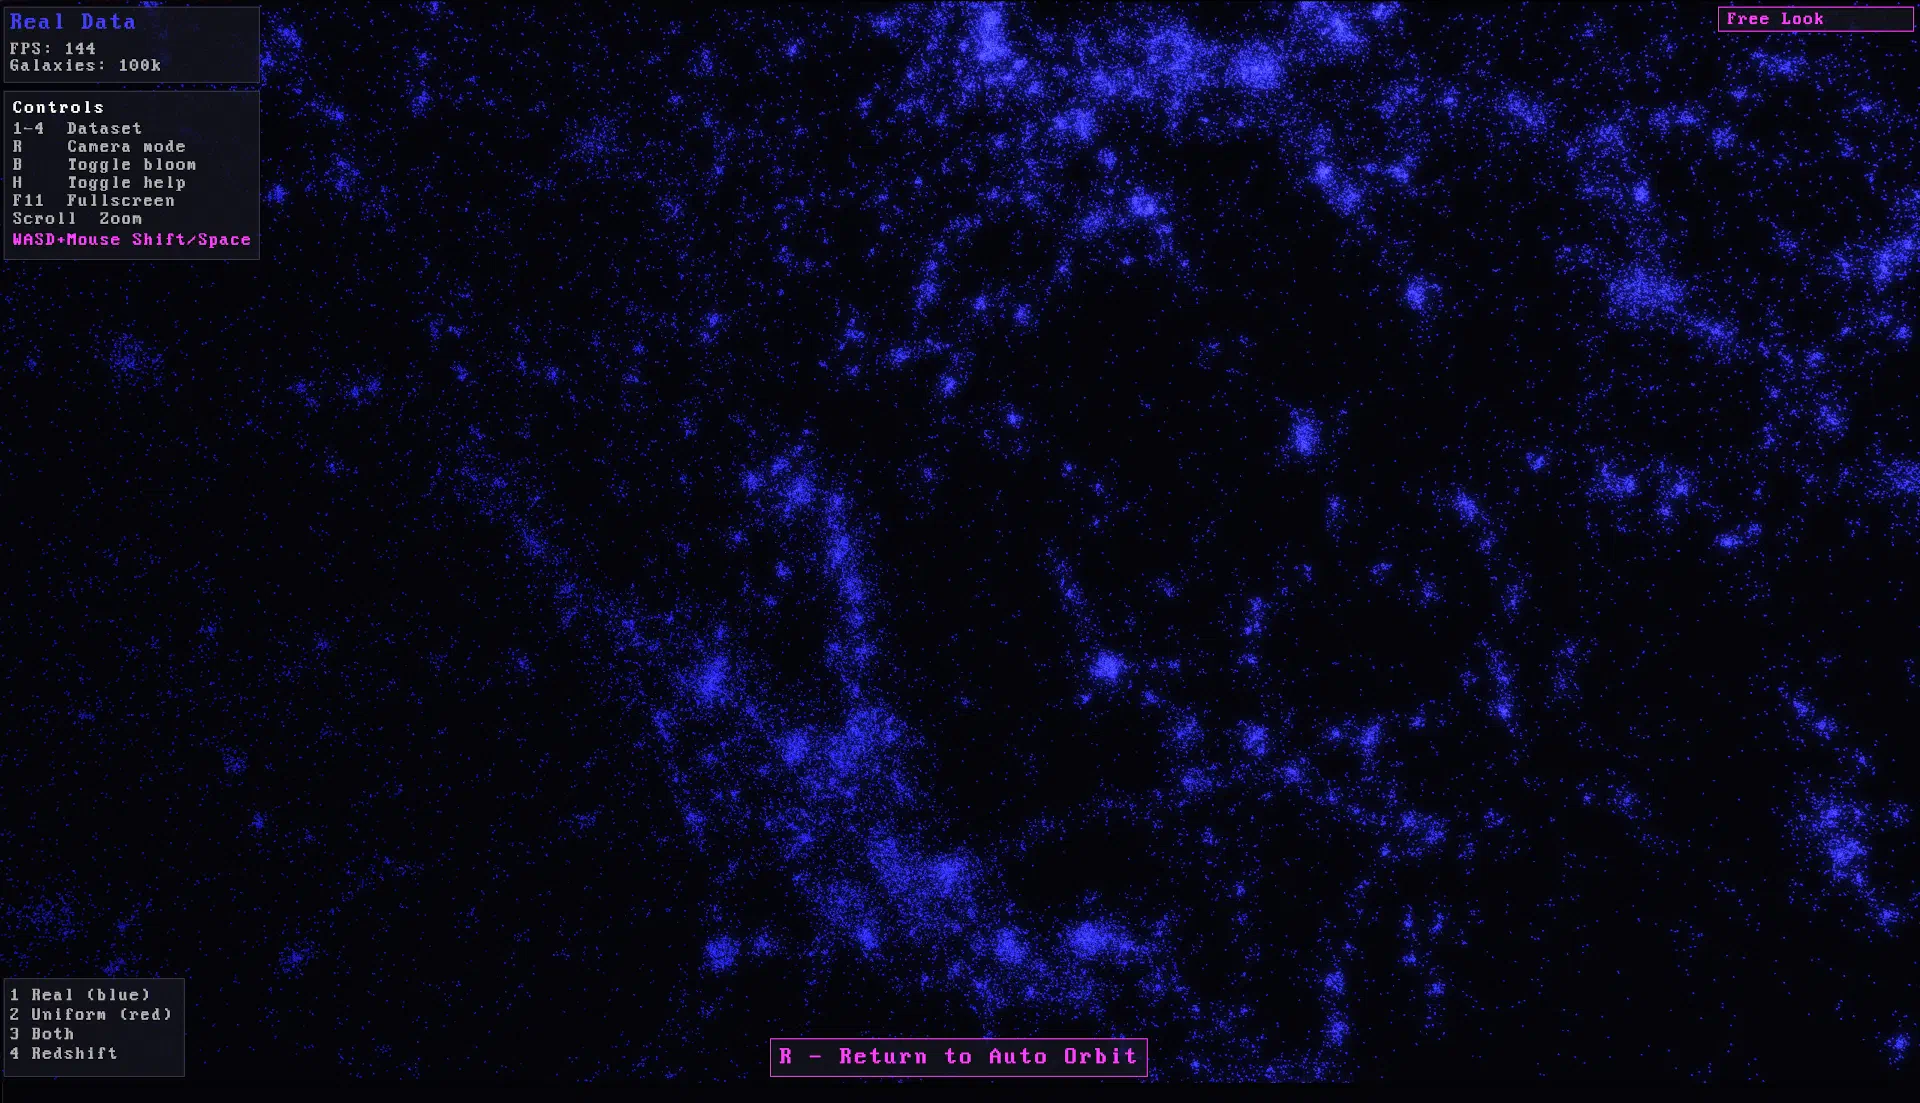
Static view of the 100k real galaxies. 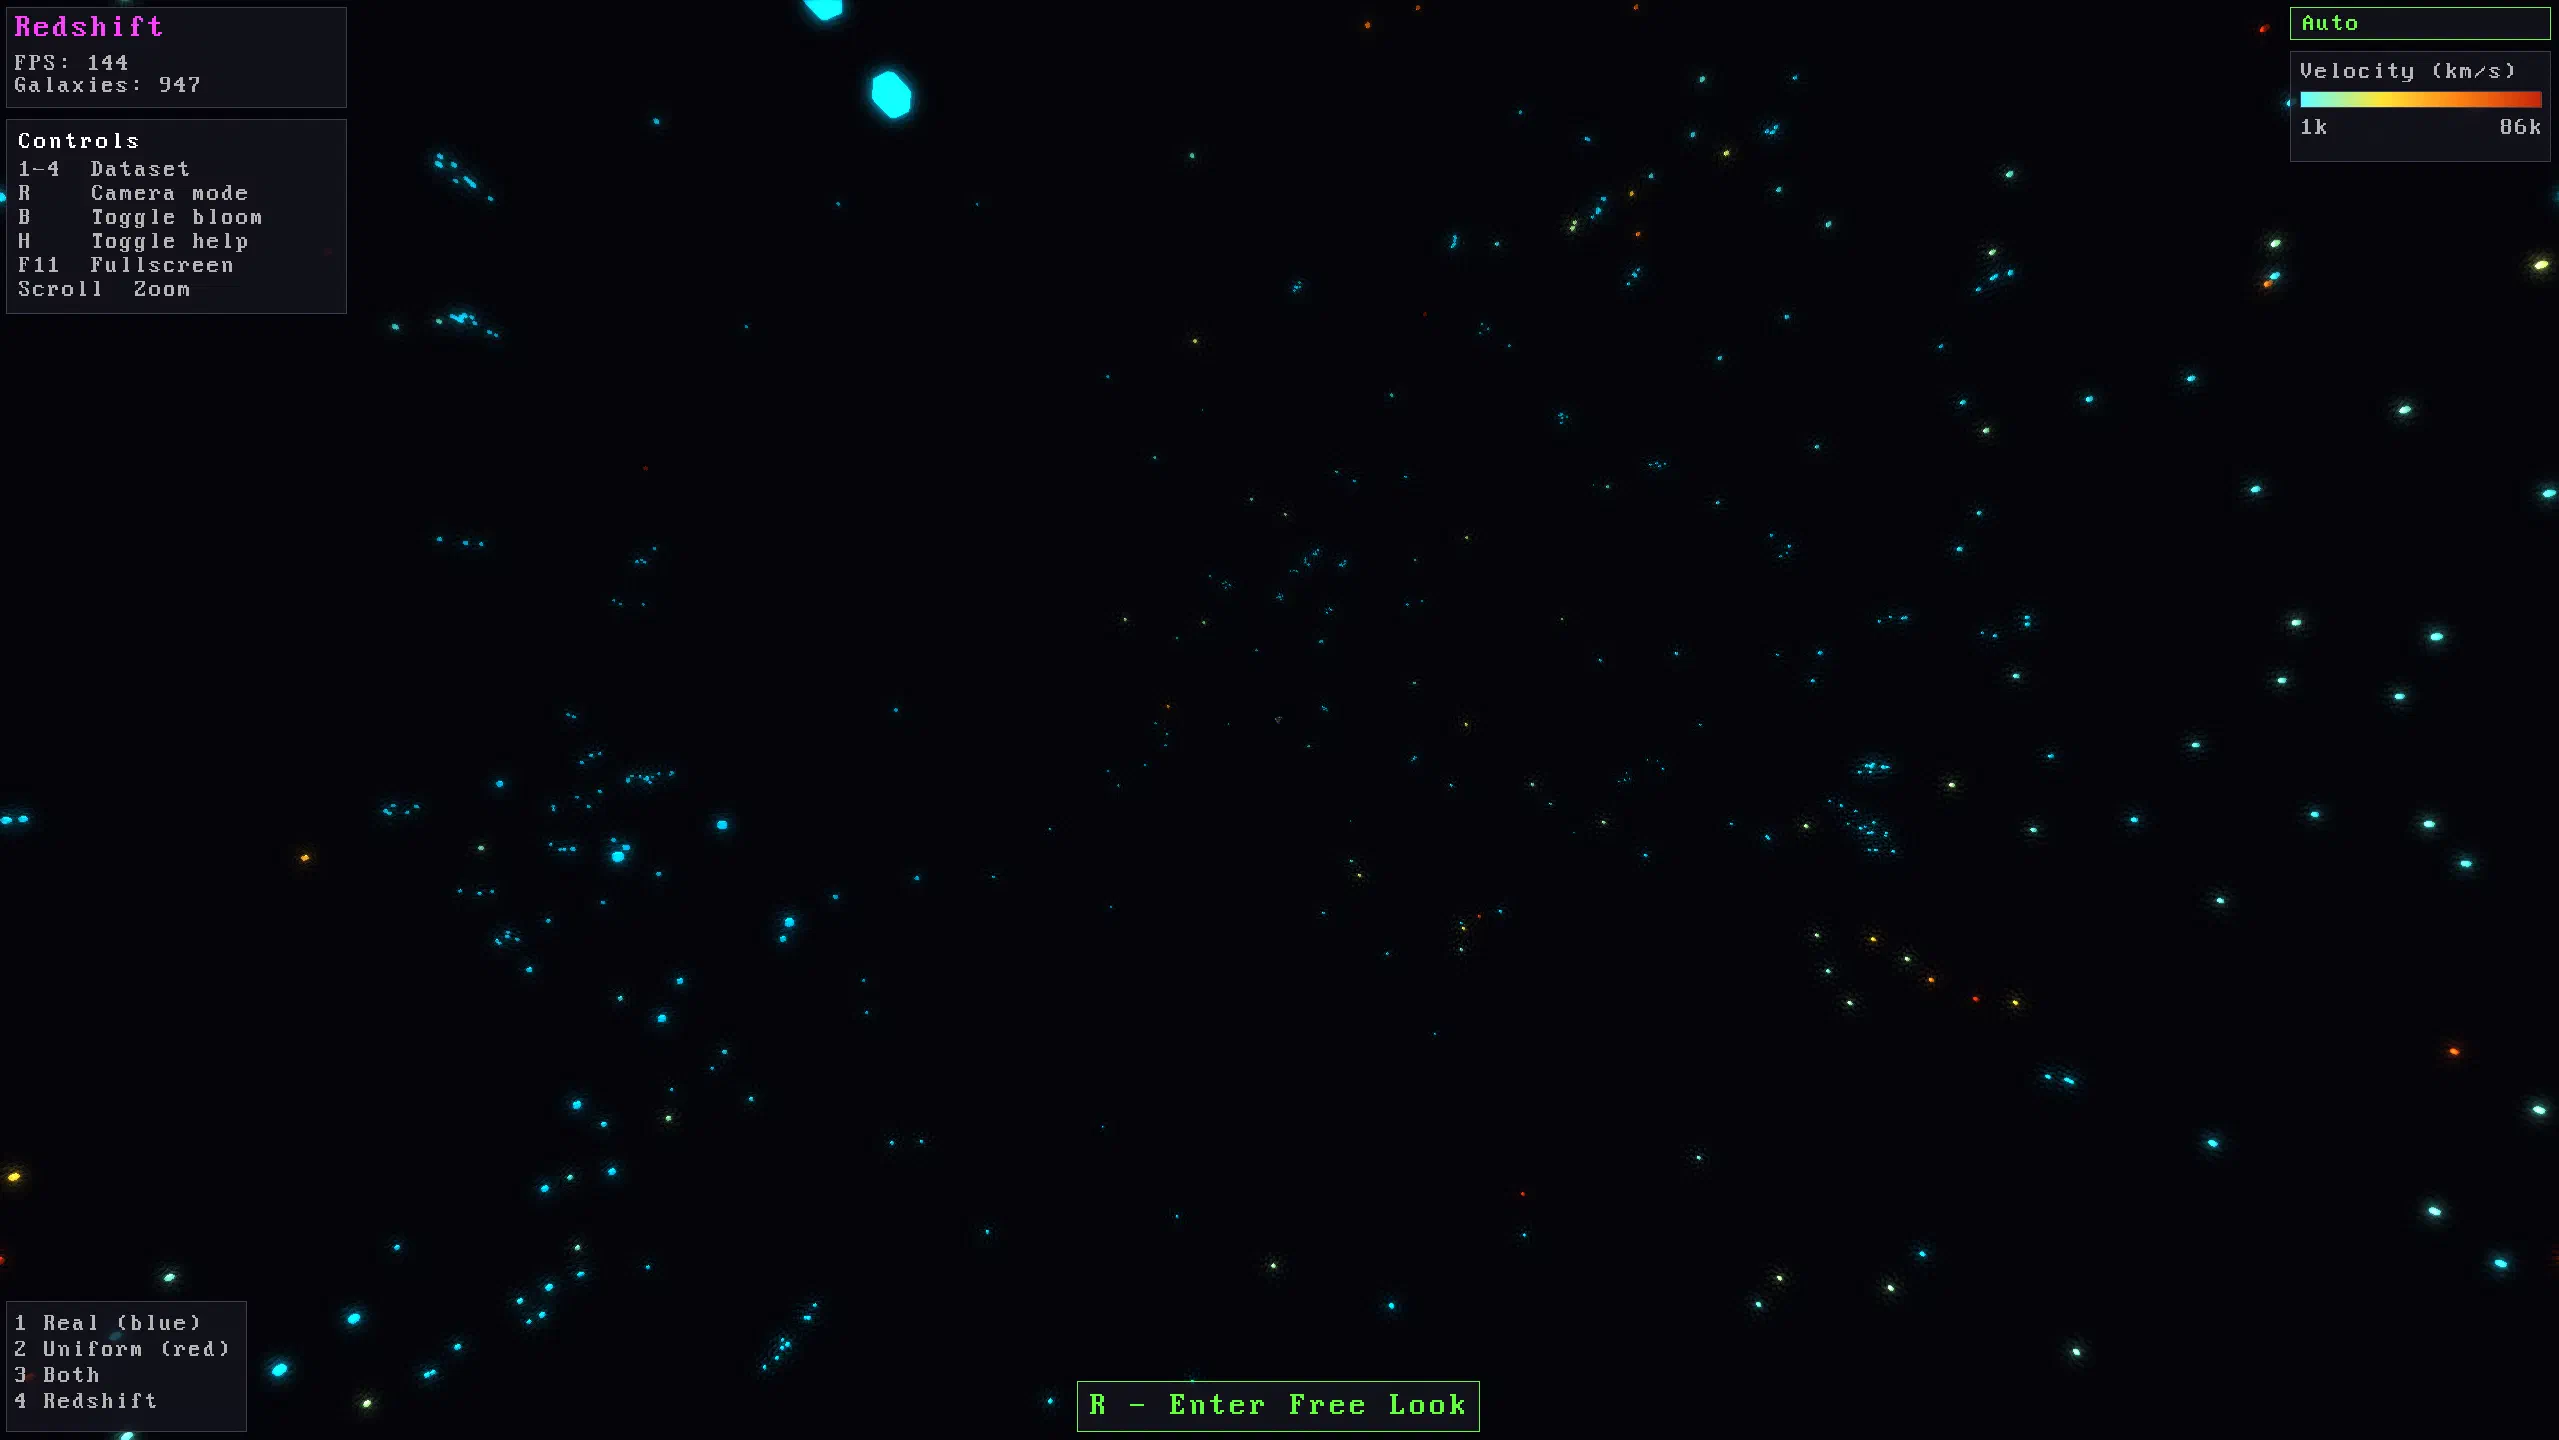
Static view of the redshifted galaxies.