HPC Job Observability Service
A Go service that tracks Slurm job resource usage and exports it as Prometheus metrics.
Highlights
- Microservice for tracking HPC job resource utilization
- Exports metrics in Prometheus format for easy monitoring
- Integrates with Slurm workload manager for job data
- Containerized with Docker for easy deployment
Overview #
The HPC Job Observability Service is a specialized microservice proof of concept (POC) designed to bring modern observability practices to High Performance Computing (HPC) environments. Traditional HPC workloads often run as “black boxes” from a metrics perspective. This service bridges that gap by integrating directly with the Slurm workload manager to provide real-time tracking of job resource utilization (CPU, Memory, GPU).
The Problem #
In many HPC clusters, it is difficult for administrators and users to understand exactly how resources are being utilized during a job’s execution. Questions like “Is my job actually using the GPU?” or “Did my job fail because it ran out of memory?” are notoriously hard to answer without detailed, time-series metrics. Standard monitoring tools often aggregate at the host level, losing the context of individual jobs.
Solution Overview #
This project provides a complete observability pipeline that links infrastructure metrics directly to specific HPC jobs:
- Slurm Integration: Uses
prologandepilogscripts to capture job lifecycle events instantly without polling. - Resource Collection: Uses Linux cgroups v2 for CPU and memory tracking, alongside vendor tools for GPU metrics.
- Metrics Export: Exposes data via a Prometheus-compatible endpoint, making it easy to create granular Grafana dashboards.
System Architecture #
The system follows a clean microservice architecture built with Go, designed for stability and low overhead on compute nodes.
Lifecycle events, data collection, and metrics export #
flowchart LR
  Cluster["HPC Cluster<br/>(Slurm jobs)"]
  Service["Observability Service<br/>(Go + REST API)"]
  DB["PostgreSQL<br/>(jobs, metrics, audit)"]
  Mon["Prometheus + Grafana"]

  Cluster -->|"prolog: job-started<br/>epilog: job-finished<br/>collector: metrics"| Service
  Service --> DB
  Mon -->|scrape /metrics| Service
Microservice Architecture #
flowchart TD
  Ext["External systems<br/>(HPC schedulers, monitoring tools)"]

  subgraph Svc["HPC Observability Service"]
    direction TB
    HTTP["HTTP server (net/http)<br/>/v1/health · /v1/jobs<br/>/v1/jobs/{id}/metrics · /metrics"]
    API["API handlers<br/>request validation<br/>business logic coordination<br/>response formatting"]
    Store["Storage layer<br/>job CRUD, metrics recording<br/>retention management"]
    Exp["Metrics exporter<br/>Prometheus gauges/counters<br/>job state aggregation"]
    Coll["Collector<br/>periodic metric sampling<br/>cgroup / GPU metrics"]
    BG["Background goroutine"]

    HTTP --> API
    API --> Store
    API --> Exp
    Store --> Coll
    BG --> Coll
  end

  DB["PostgreSQL"]

  Ext --> HTTP
  Store --> DB
Core Components #
- HTTP API (Go): Built with
net/httpand adhering to OpenAPI specifications (Design-First). It handles lifecycle events and acts as the bridge between raw system data and proper observability standards. - PostgreSQL Storage: Maintains the canonical state of jobs, their history, and high-resolution audit logs of all state changes.
- Metrics Exporter: A custom Prometheus exporter that maintains real-time gauges for runtime, CPU usage, memory usage, and GPU utilization.
Technical Highlights #
Event-Based Slurm Integration #
Instead of polling Slurm (which can be slow and stressful for the scheduler), the service uses an event-based approach.
- When a job starts, a lightweight
prologscript fires a webhook to the service (/v1/events/job-started). - When it ends, an
epilogscript does the same (/v1/events/job-finished), capturing the exit code and signal to accurately determine if the job completed successfully, failed, or was cancelled.
Audit Logging & Traceability #
HPC environments frequently require traceability: who changed a job, what changed, and why. To support this, the service stores an audit trail of job lifecycle events and updates.
At a high level, each significant change to a job results in an audit event that captures:
- Change type (create/upsert/update/delete)
- Actor (for example:
slurm-prolog,slurm-epilog,collector,api) - Source system (Slurm vs mock vs manual API)
- Correlation ID to group related operations across the job lifecycle
- Snapshot of the job at the time of change (for debugging and compliance)
This makes it much easier to debug cases like “why did a job become cancelled?” or “when did we start sampling metrics for this job?” without relying on ephemeral scheduler logs.
Granular Metrics #
The service pushes the boundaries of standard monitoring by collecting:
- CPU Usage: Real-time percent utilization per job.
- Memory: RSS and Cache usage extracted directly from cgroups.
- GPU: Utilization metrics for NVIDIA and AMD cards.
This granularity allows for detailed dashboards where users can correlate code execution phases with resource spikes.
API-First Design with OpenAPI Code Generation #
This project follows an API-first workflow: the OpenAPI specification is treated as the source of truth, and Go types + server interfaces are generated from the spec.
In practice, that means the development loop looks like:
- Update the OpenAPI YAML specification
- Run code generation (
go generate ./...) - Implement or update handler logic against generated interfaces
The benefits are substantial for a microservice that needs to stay maintainable:
- Spec-driven development: the contract is clear and reviewable
- Type safety: fewer runtime errors and less hand-written boilerplate
- Faster iteration: adding endpoints and models becomes mostly “edit spec → generate → implement”
- Consistency: request/response structures are enforced across the codebase
Results #
This tool provides a “glass box” view into HPC jobs, enabling:
- Better Debugging: Users can see exactly when and why a job crashed.
- Efficiency: Admins can identify jobs requesting way more resources than they consume.
- Transparency: Real-time dashboards available to both operations teams and end-users.
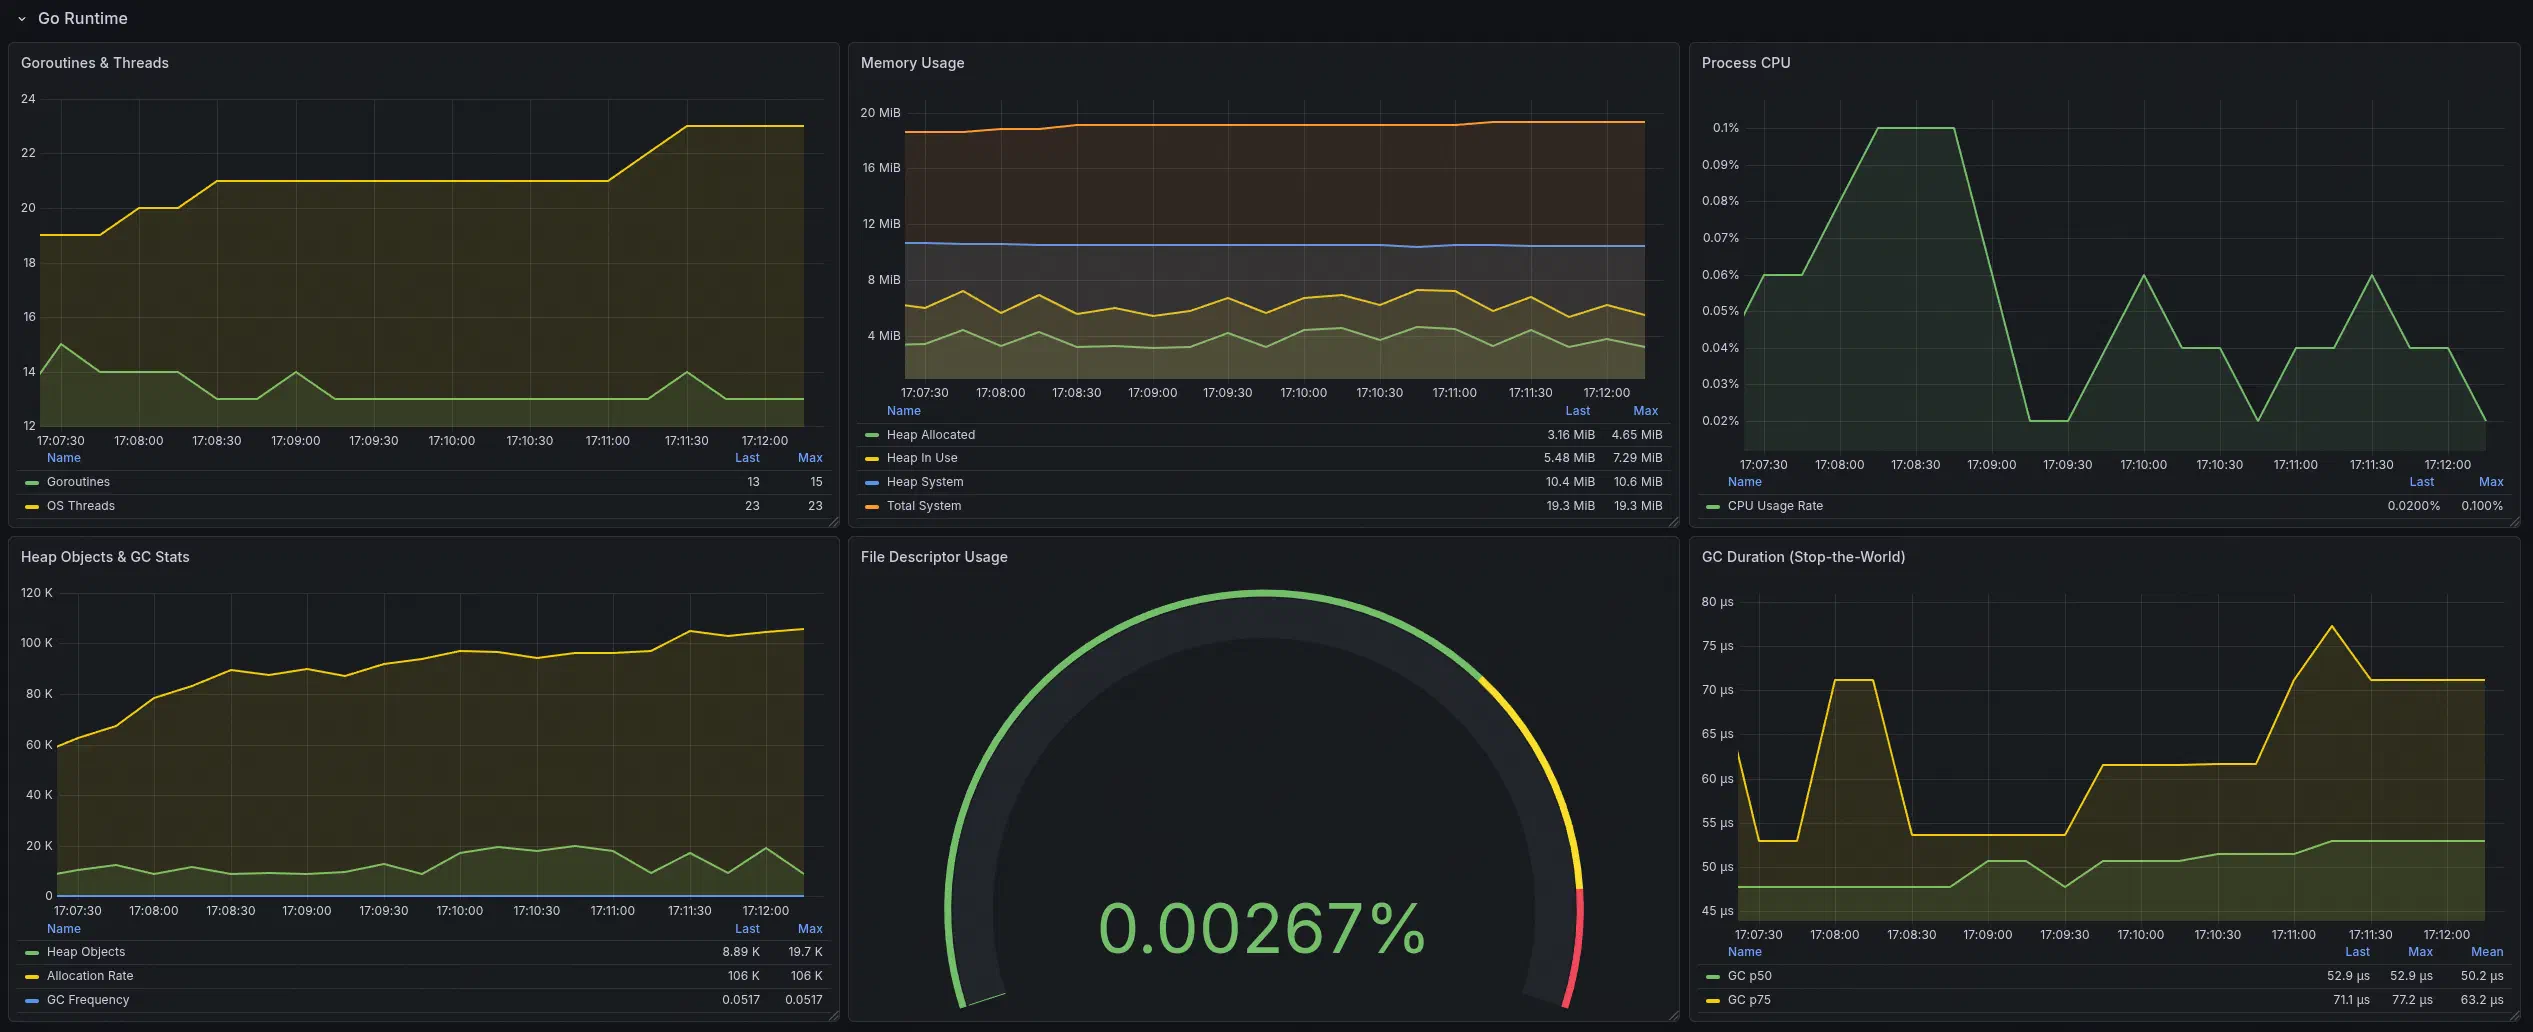
Grafana Dashboards (Examples) #
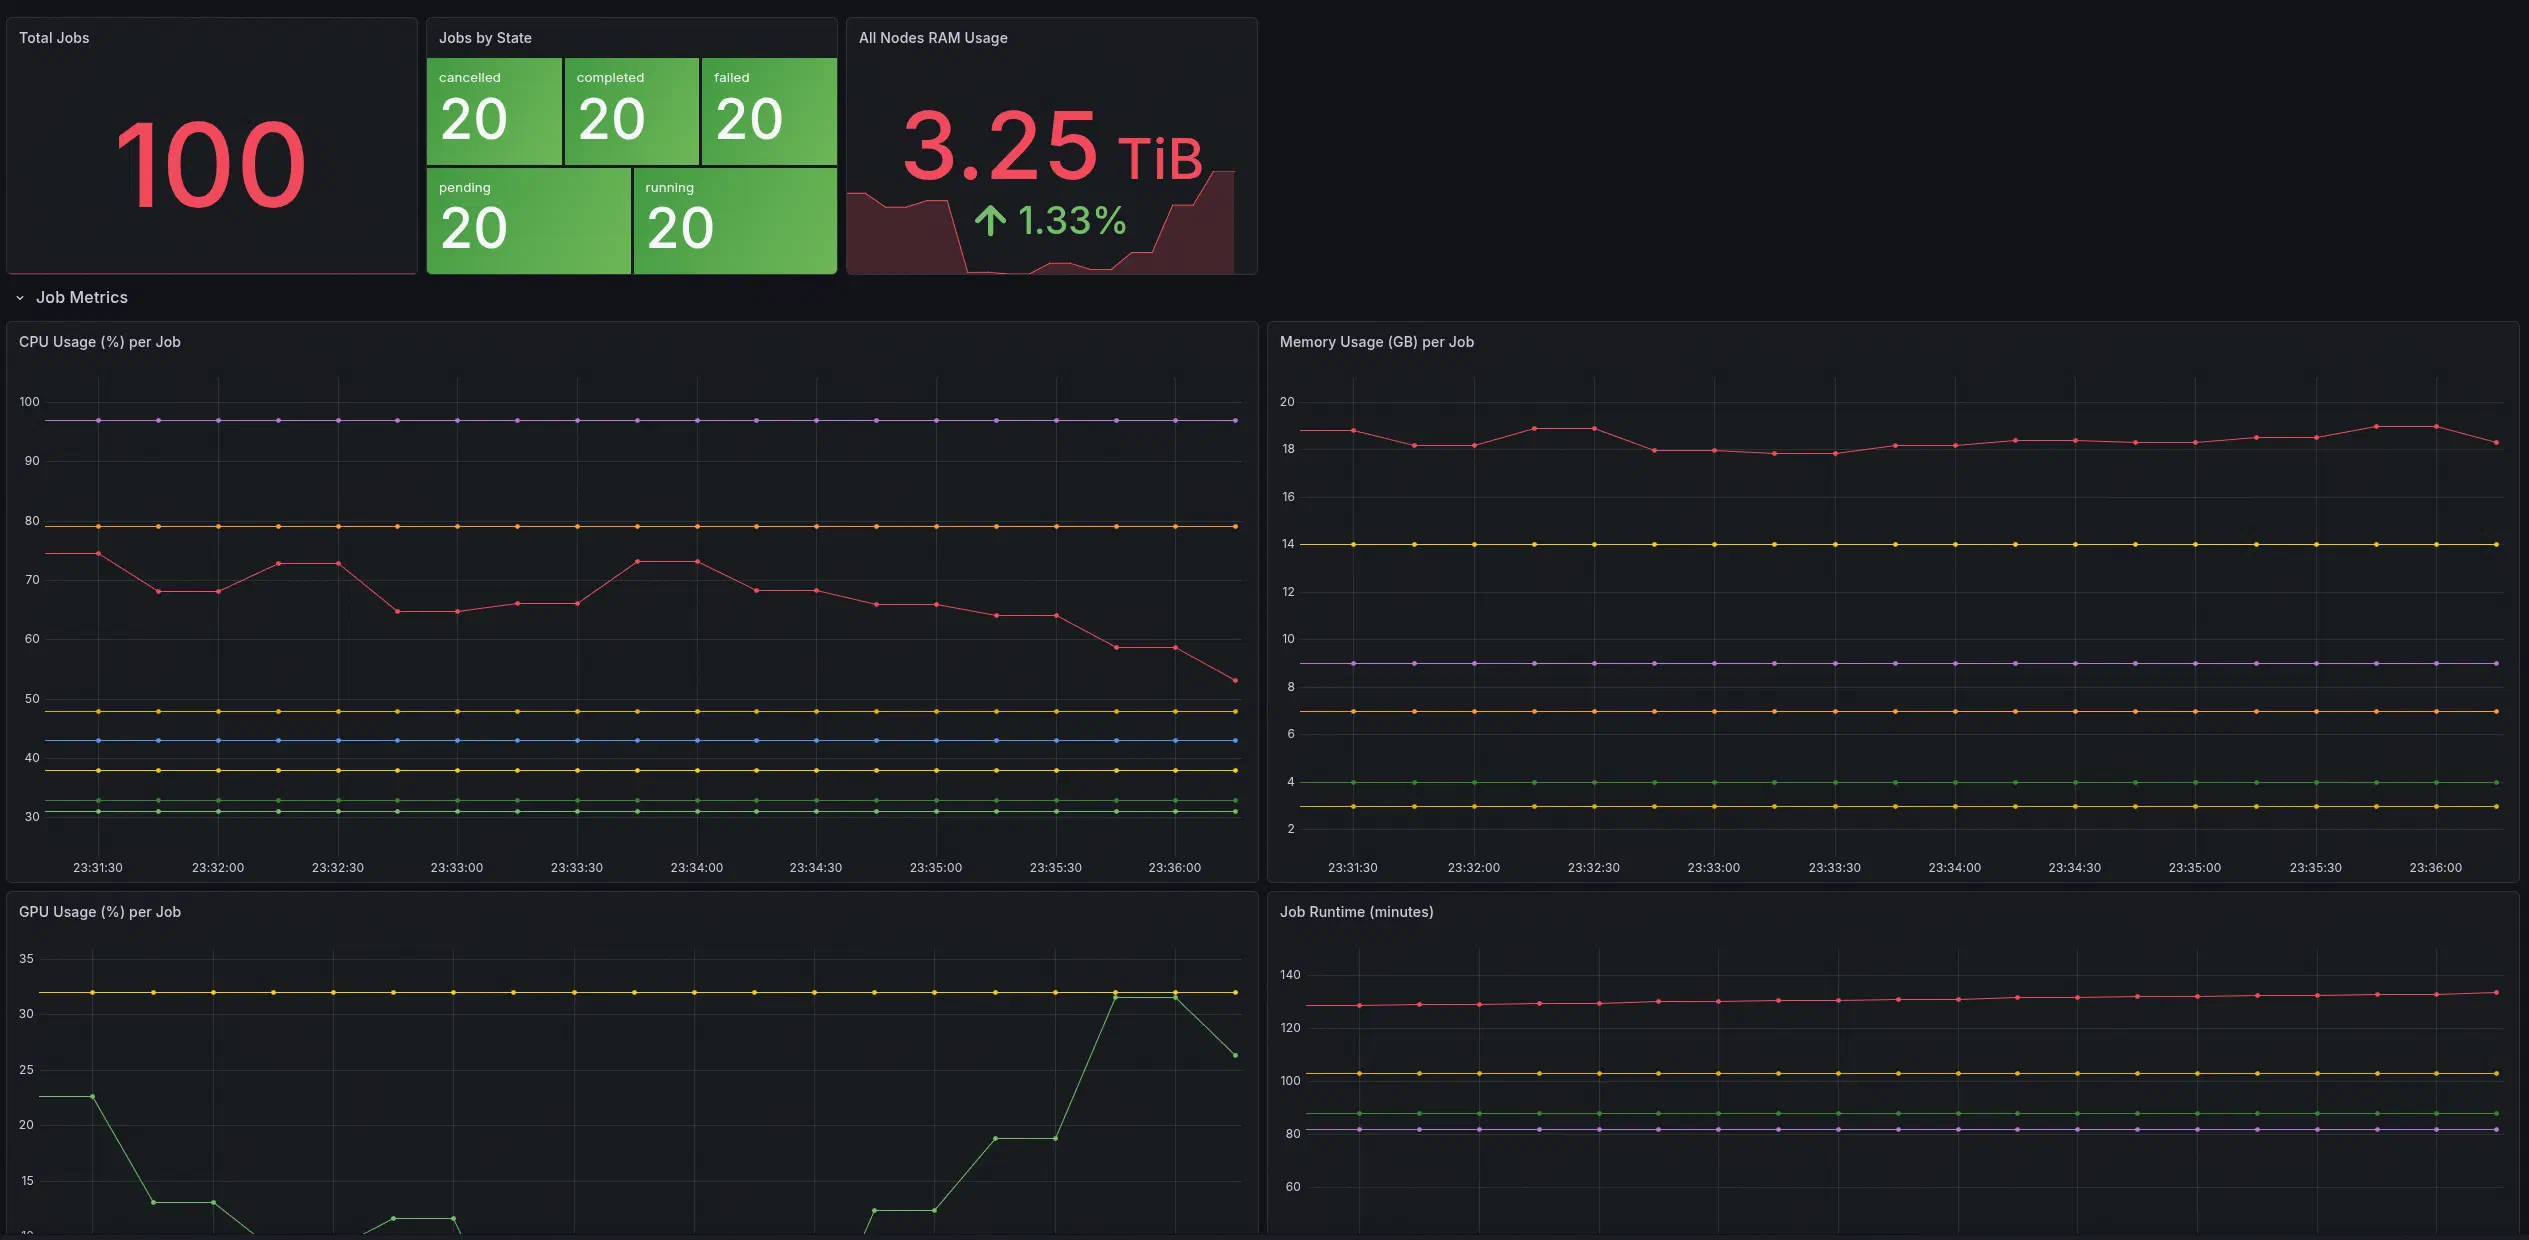
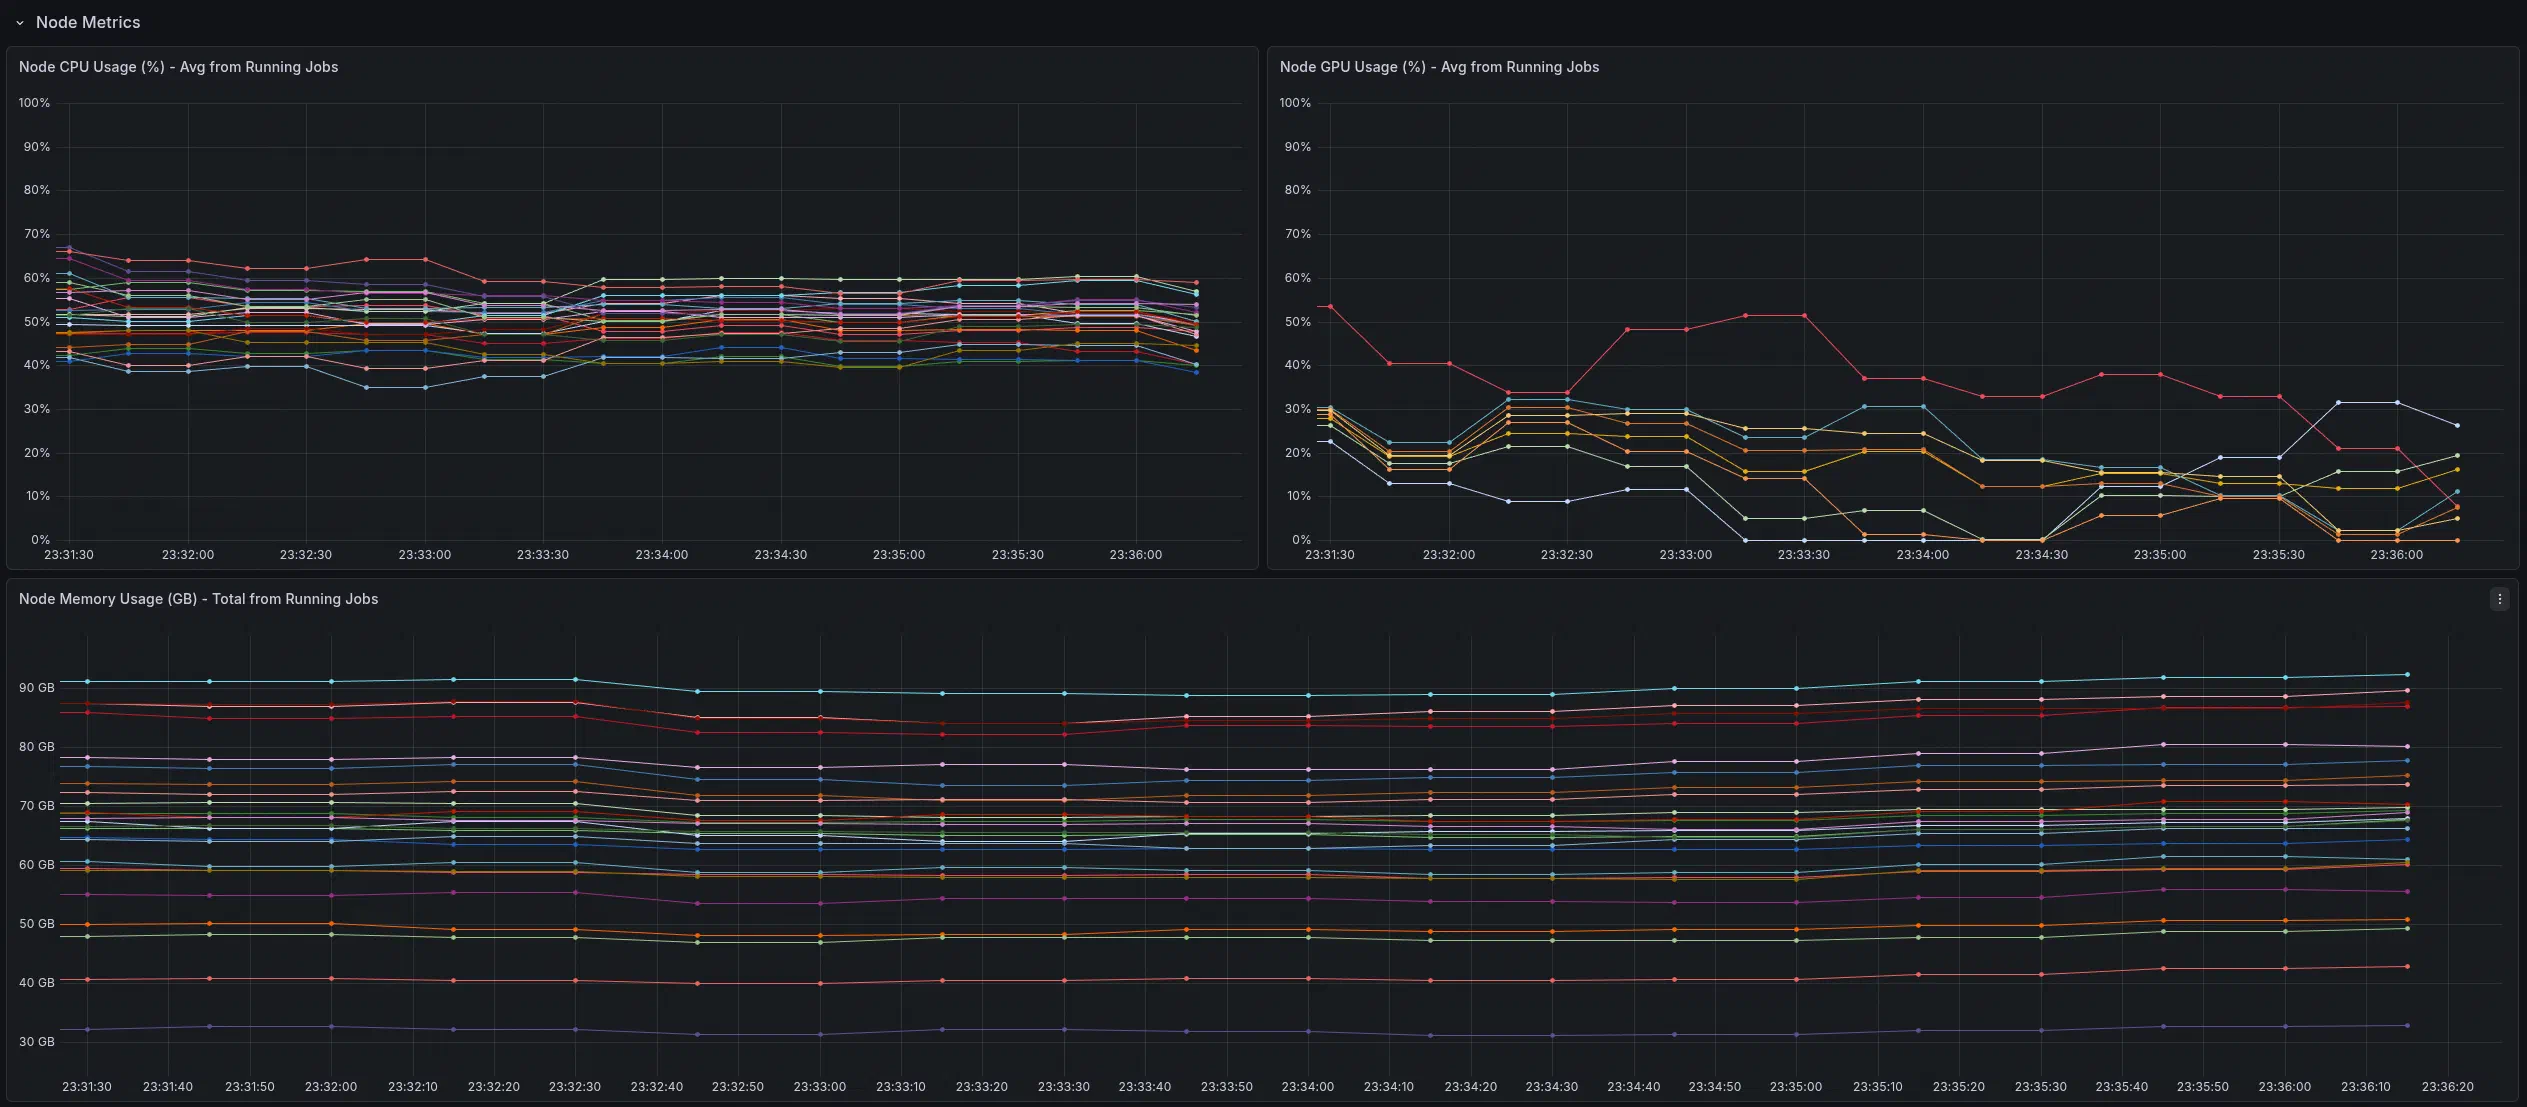
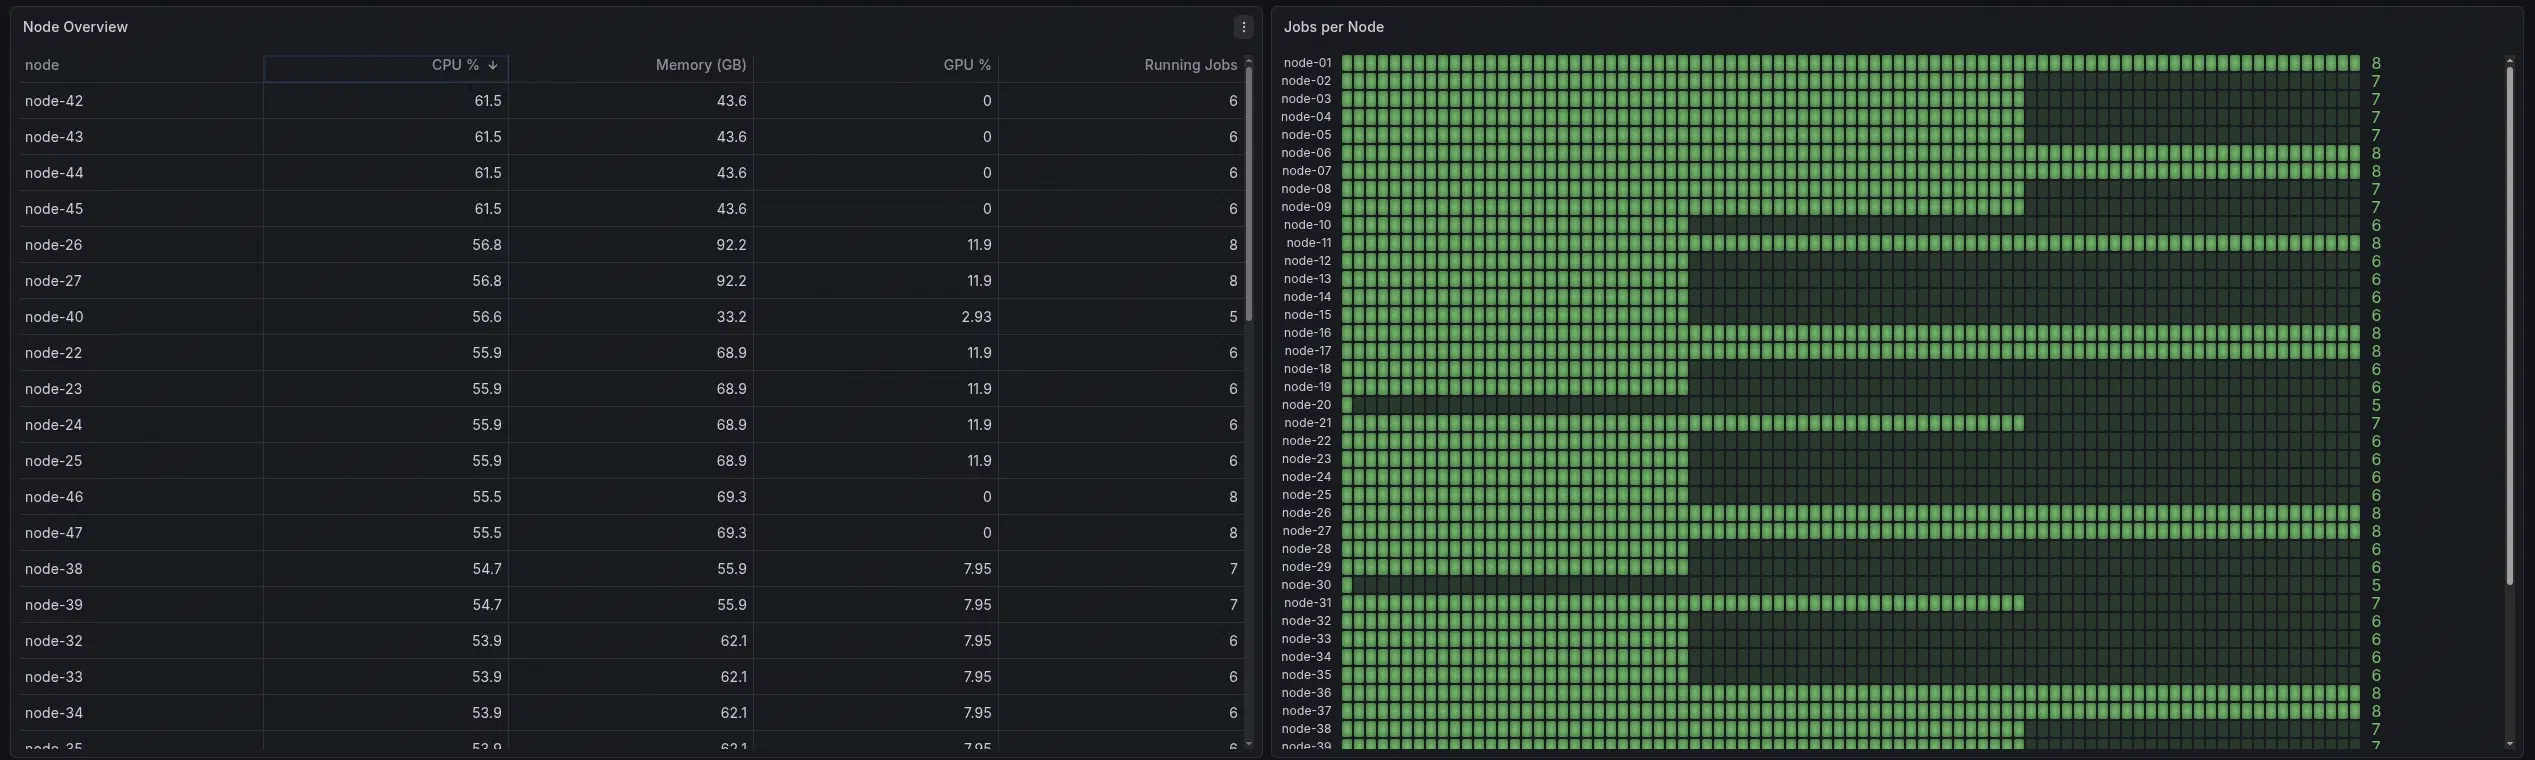
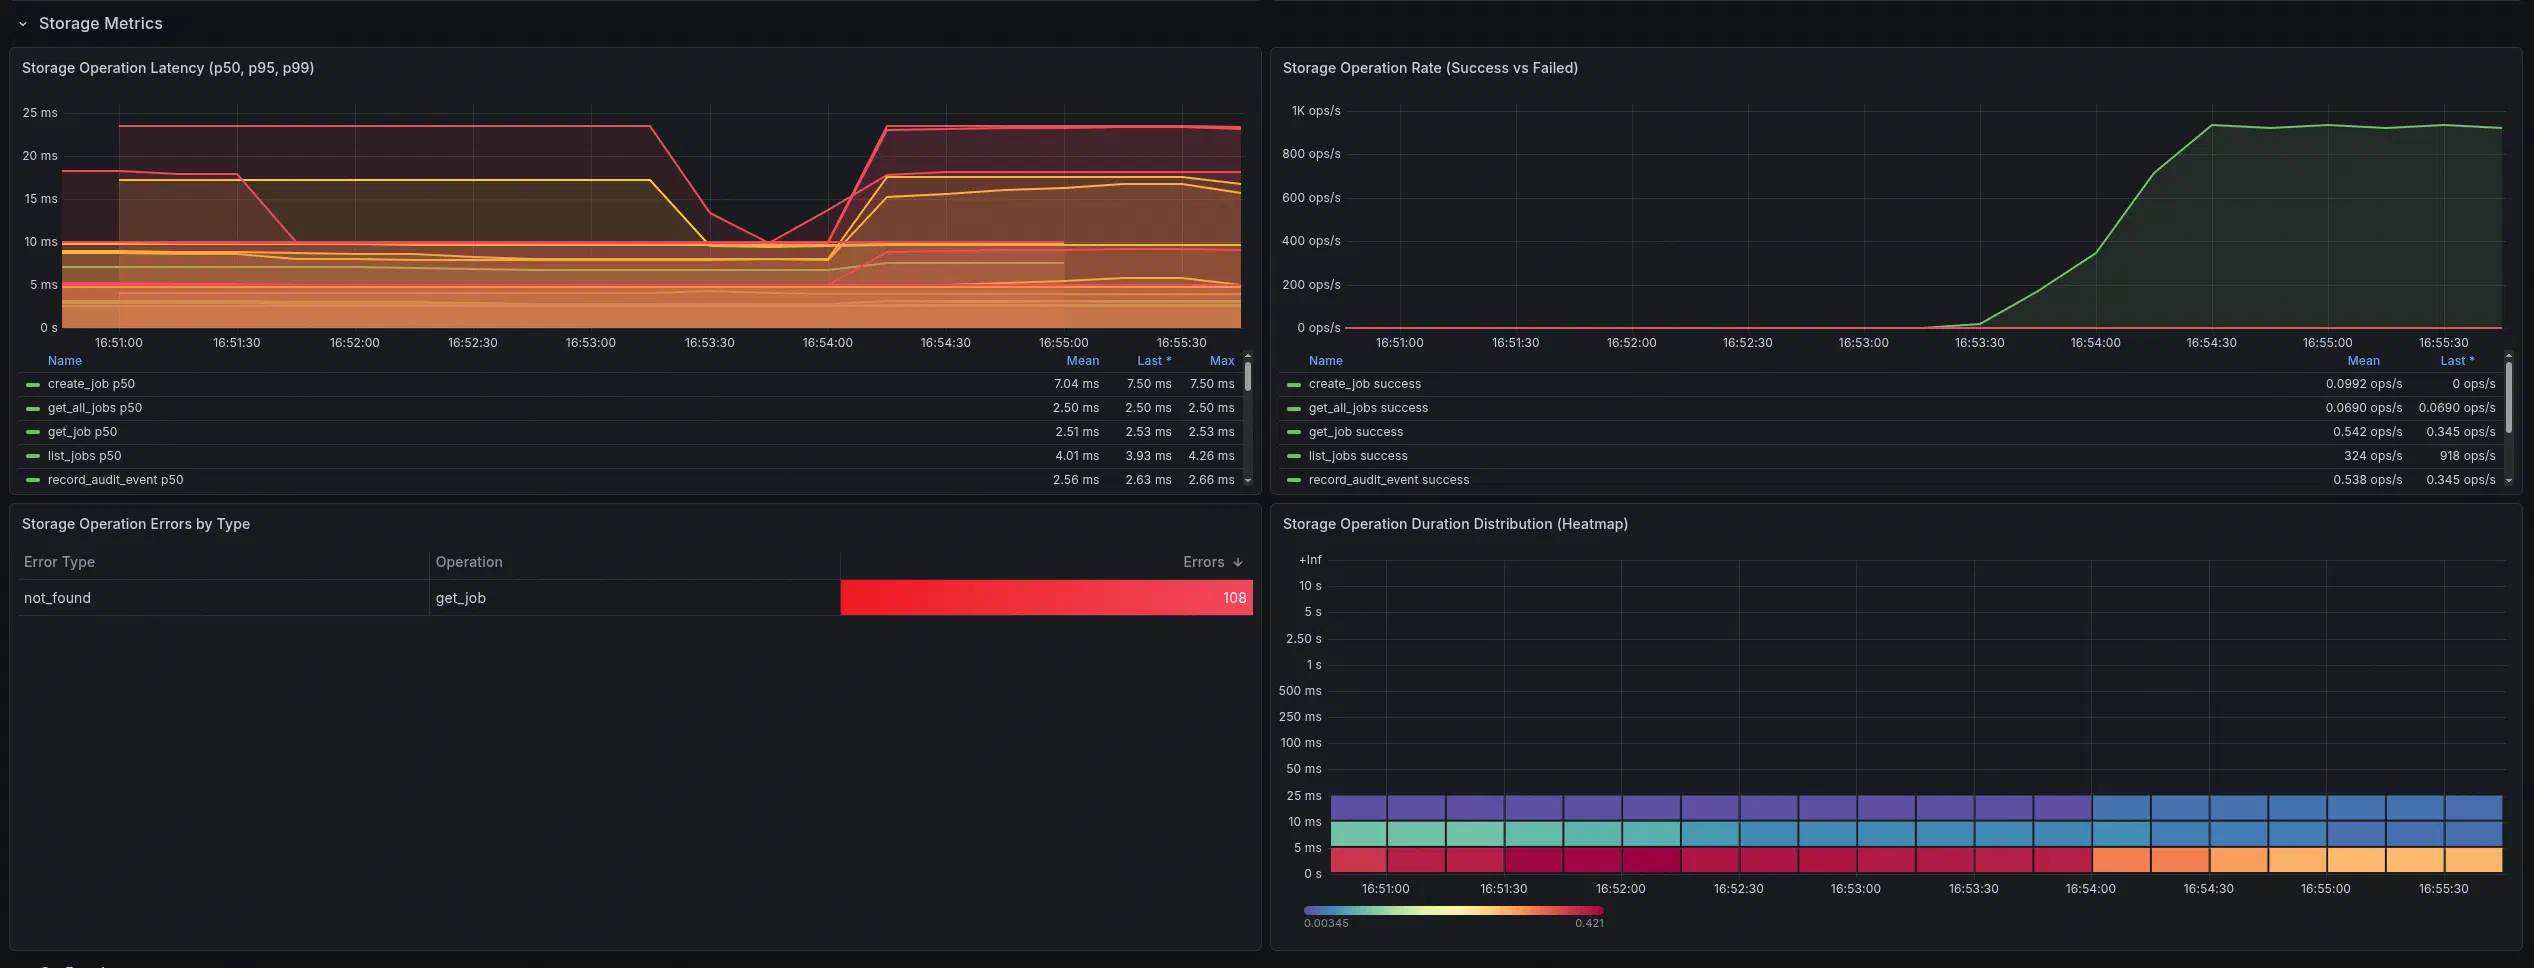
Once metrics are exported in Prometheus format, Grafana dashboards can provide an immediate “single pane of glass” for both job-level and node-level resource behavior.
Limitations & Next Steps #
This service is intentionally a proof of concept, focused on validating the architecture and data flow rather than being a hardened, production-complete platform.
There are plenty of directions to take it further: stronger auth and multi-tenancy, deeper scheduler integrations, better error handling and backpressure, richer GPU accounting, and deployment tooling that could survive an on-call rotation.
It’s not a perfect complete solution today, but it’s a strong foundation that could be used to develop something even better.